
Gain visibility into course usage
Content Controller’s built in reporting and analytics tools help you quickly and easily answer questions like:
- What are the most popular courses in your library and should be prioritized for updates?
- How many accounts have access to courses? And what titles are they using most frequently?
- How many learners pass/fail rates and what does the score distribution look like?
Now, you can finally understand usage patterns across all of your clients and their learners. Seeing how your courses are actually being used helps you craft strategic content plans and identify how to create more effective courses to help you sell more.
What reports are available?
Content Controller offers many different reports to help you track usage across accounts, courses and learner level details.
-
Usage reports
Easily see usage data based on the license type, high-level course usage across all accounts, and how a specific account is using your courses.
-
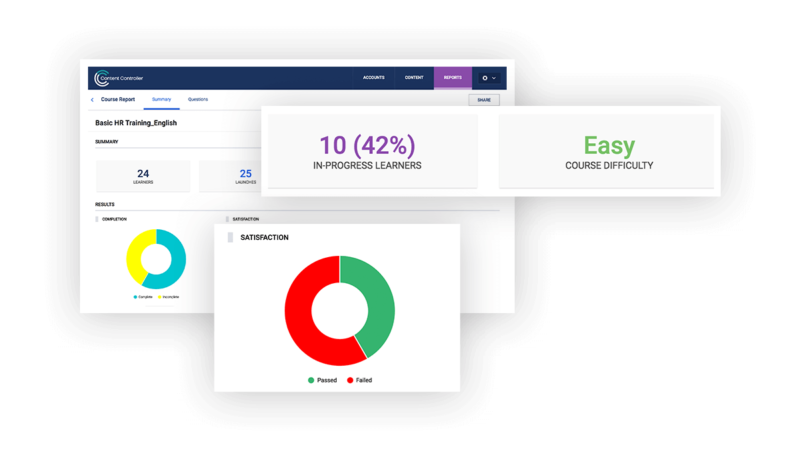
Course reports
Get aggregated analytics for each course across all account deployments. See which courses are the most popular, identify outlier data and get useful feedback for your content creators.
-
Learner reports
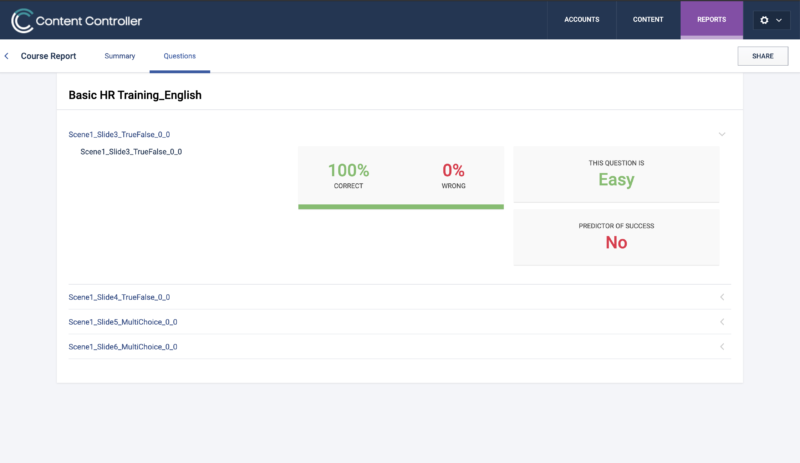
Drill down all the way to the learner level to see exactly how a learner interacted with a course, including question-level analytics.
See and share your data
Content Controller’s analytics and visualizations not only present your data in a beautiful way, but make it easy to share out with your team. All reports in Content Controller can be exported as a .csv or shared via public URL.
Questions about reporting in Content Controller?
Reach out to ask us anything or schedule a demo.